Escaping the black box: A Product Manager's journey from confusion to clarity

Every Product Builder knows the feeling of the "Valley of Confusion." It is a sinking situation when you are building features and shipping releases, but deep down, you don't really know if any of it matters. You are fighting conflicts, guessing at solutions and hoping for the best.
For years, I was stuck in that valley. I was climbing a ladder that didn’t reach the top. But my journey from a Junior Product Owner to a data-driven Product Manager taught me one crucial lesson: You cannot own the product if you don't own the data.
Here is the story of how I escaped the black box and why every PM needs to build a bridge between the code and the customer.
Phase 1: The Fog of War
In my first role as a Product Owner, I lived at the bottom of the ladder. My days were consumed by concrete tasks:
- Checking Jira tickets.
- Building wireframes & debating mockups with Design, Product team.
- Pushing small enhancements into the sprint.
At the very top of the ladder, high management team had a clear abstract goal: "Drive Revenue".
The problem?
There were no rungs in between. I knew what to build because the business told me to, but I didn't understand why it would work. I was executing demands, not solving problems because I couldn't touch the data, like a blind person.
From my story
I remember specifically working on a Combo Data feature for an E-Wallet ecosystem. The hypothesis was clear: we already had high revenue from Telco top-ups and Data bundles separately. The logic was that combining them into a package with free voice calls would naturally uplift the revenue.
But life is not a dream. The adoption rate was painfully low.
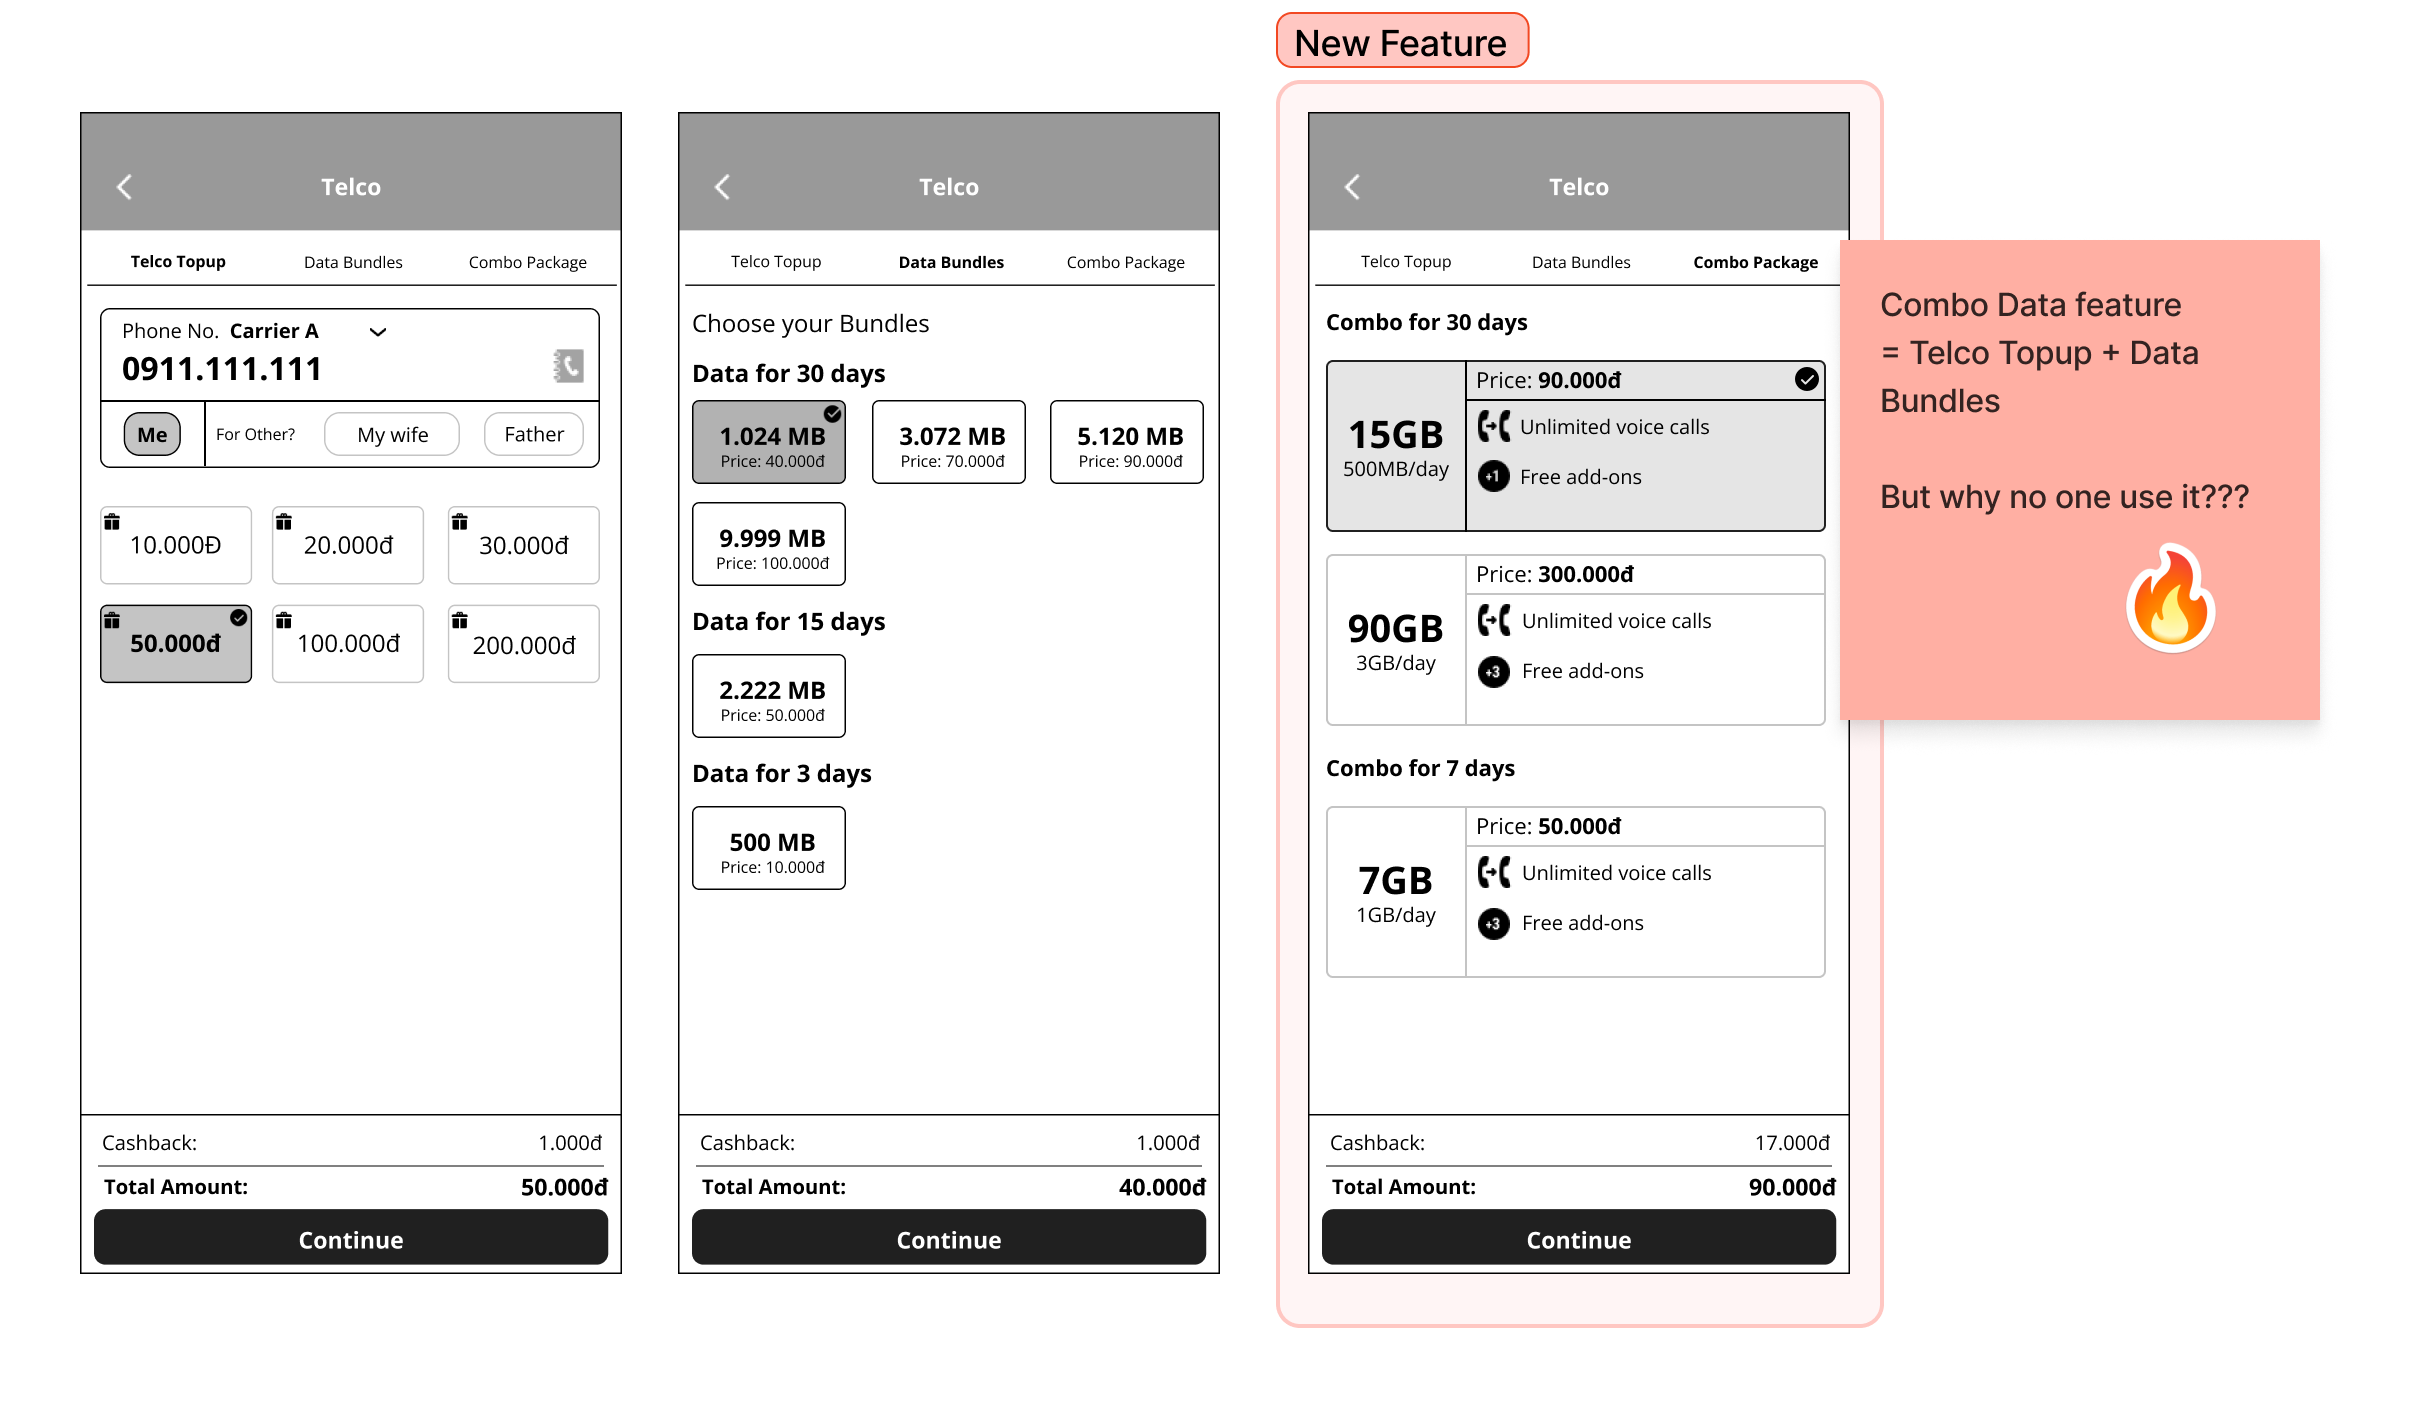
I stared at the funnel charts, watching customers bypass this new feature to access the old, separate sections. I was stuck because of the result (low conversion), but I couldn't see the cause. Why were they ignoring it? Was it the price or the UI? Because I couldn't query the data myself to see the user paths, just guessing...
Lesson learned
I realized later that I was looking at the failure in a wrong way. In fact, there's a small portion of customers did choose the product.
Instead of being paralyzed by the general failure and stuck in finding a way to optimize UI, I should have used a data mindset to look at segmentation:
- Who were those few users?
- What were their demographics?
- Why did they convert when others didn't?
Key takeaway: Don't just stare at a funnel and do nothing. Deep dive into customer, analyze their behavior and conduct interviews with them.
Phase 2: The Fragmented Truth
In my second company, I moved up a step with KPIs & metrics. However, accessing them was a nightmare to see the whole picture by stitching it together manually. I faced two specific data challenges that turned my daily life into "Excel Hell."
Challenge 1: The boring Postman process
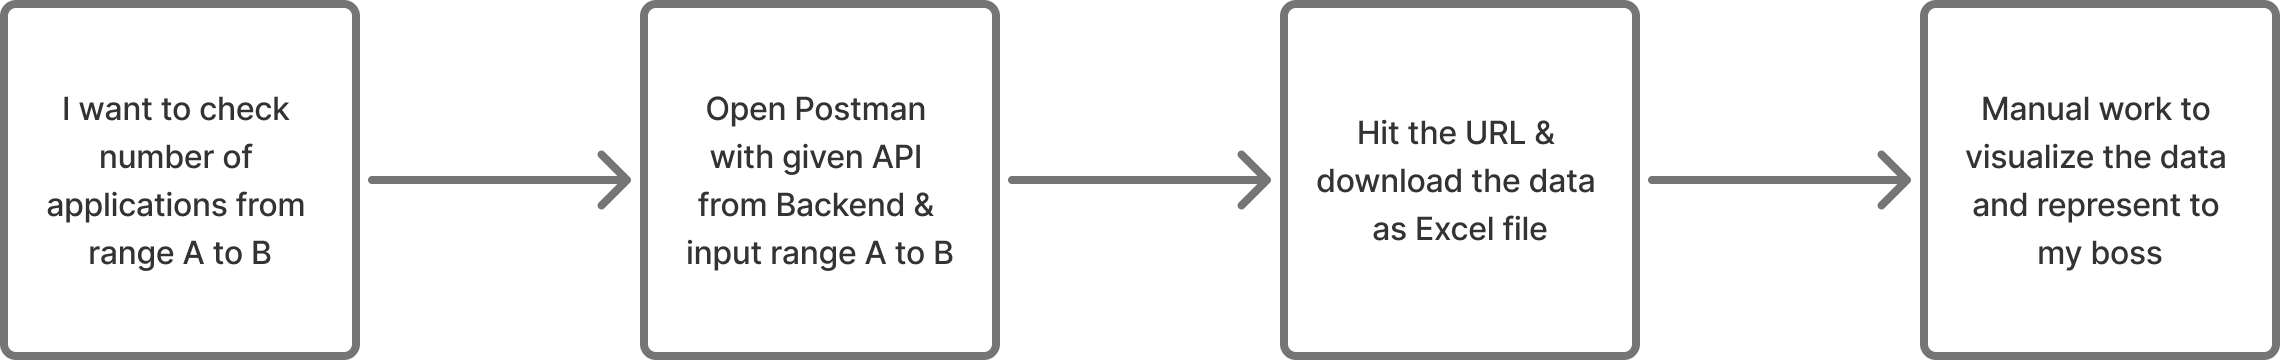
The goal was clear: "Represent the number of applications from Date A to Date B with key takeaways to my boss". But the reality was absurdly technical for a small process like that. I didn't have a dashboard and needed to act like a Product Operator:
- Open Postman & load the specific API endpoint provided by the Backend team
- Manually input the date range into request parameters
- Hit Send, wait for the response and download the aggregated data as an Excel file
- Spend time manually visualizing that data to present it as a simple chart
Pain points: Cannot download data in long duration (more than 2 weeks). In this case, I need to download separated files, merge them into 1 file & worked on it.
Challenge 2: The multi-channel chaos
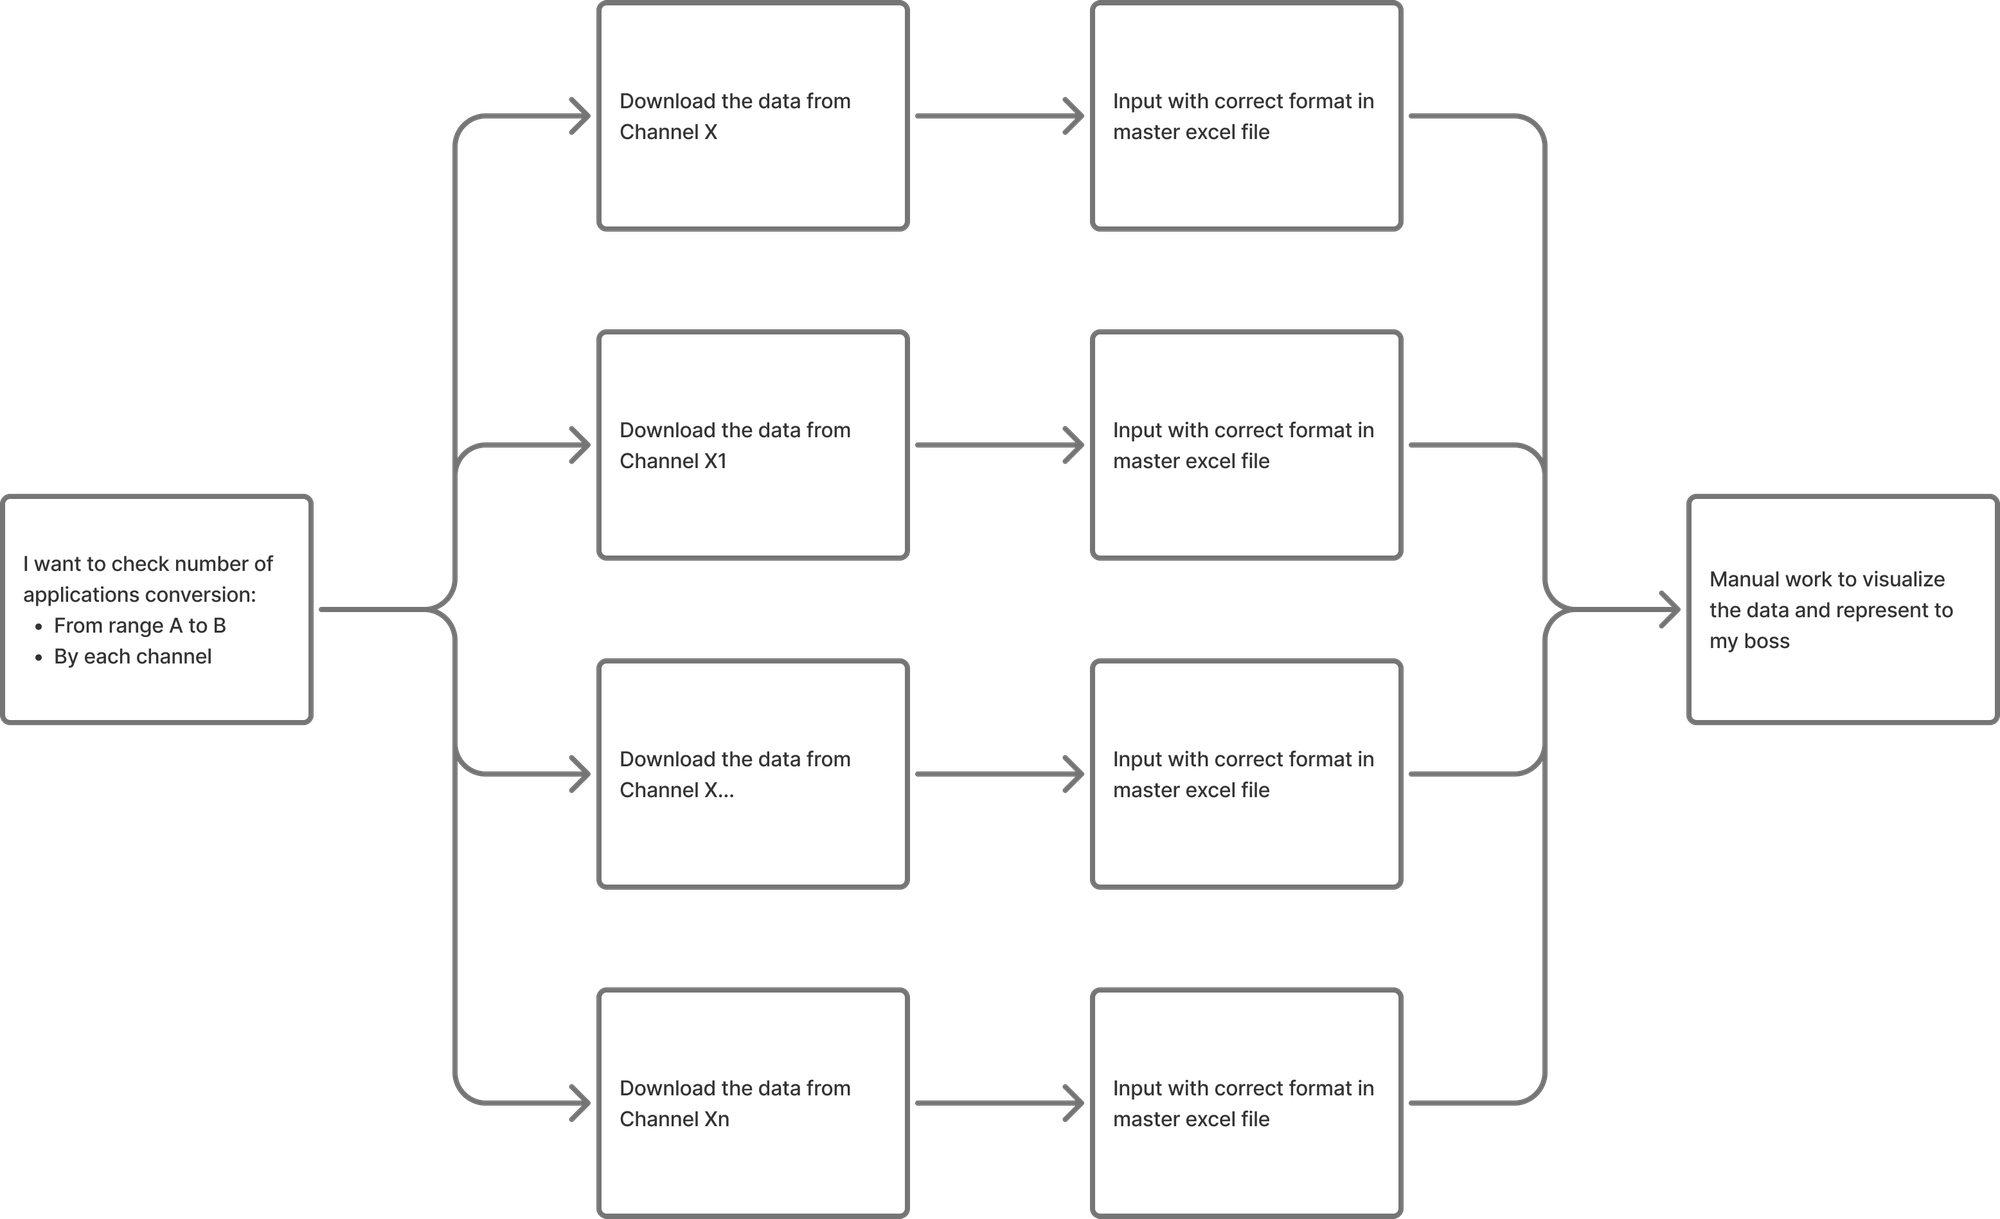
Things got exponentially worse when I needed to analyze conversion by channel. Imagine trying to build a single "Application Conversion" report. I couldn't just query the database or downloaded from any dashboard because I had to:
- Download data separately from each Channel X, X1, X...n
- Open a Master Excel File and manually paste each dataset, ensuring the formatting matched perfectly across all tabs.
I was spending 80-90% of my time acting as a human data-pipeline: copying, pasting & formatting. After that, only a small amount of my time actually looking for insights. I had the metrics, but they were trapped in a manual process so slow that by the time I reported them, the "news" was already old.
The lesson: When the cost of asking a question related to data is 1/2 of a normal working day, you don't even want to ask any question anymore. Always work closely with Engineer/Analytics team to prepare the latest metrics to overcome new challenges.
Phase 3: The Enlightenment
In my third company, everything changed. There's no black box anymore.
Two things happened at once that supported me a lot:
- Raw Data Access: I was writing queries to see the raw logs from any given timestamp and business logic. Also able to check the specific error codes in the system and database if issues happened.
- System Collaboration: I worked closely with a Principal Software Engineer who didn't just explain the "what is it?" but "how does it work?".
It was a huge opportunity to deep dive into the system flow and learned about edge cases that hardly ever showed up in the UI.
It's a chance to prove myself if management team asked for a problem, I didn't just guess but provided the evidence & insights:
- High management team: "Why adoption rate of the new feature is low (based on total customer base)? Why more customers are leaving our product"
- Me:
- In the overall funnel, we can see customer conversion rate is really low from beginning - Awareness stage.
- Deep dive in total customer base:
- 70% are inactive customers (not accessing the app in last 6 months).
- 30% are active customers & ~80% of them using the new feature.
- Insights gained:
- Adoption rate of the new feature is not bad (for active customer) & continue to focus on this segment.
- Additional: Further check on inactive customer segment to create new campaigns to target these guys.
And then the result? Trust.
Lesson learned: When you can connect the detail (Concrete Layer) to the business impact (Abstract Layer), you stop being a question mark in the meeting and you will become the answer.
The data mindset: 3 rules for modern PMs
Looking back at the deep valley I escaped, here is what "Data mindset" truly means. It isn't just about making beautiful charts but being able to move up and down the ladder of abstraction fluently.
1. Anchor yourself in business direction
Even at an entry level, never lose sight of the key business metrics. If you are spending time on a UI revamp, simply ask "How does it contribute to the product direction?" and if you can't answer that, please stop building. Don't waste time and let the features distract you from the big picture.
2. Discover & analyze "Why?"
Don't just look at the dashboard to see if numbers went up or down like a zombie. Try to understand the behavior change.
- Bad PM: "Conversion went up 2%."
- Good PM: "Conversion went up 2% because <impact> & <next actions>"
3. Understand the root in the age of AI
This is the most critical shift for the future. With the rise of GenAI, the black box is getting bigger.
But the true Product Manager working in Technology section with a strong domain knowledge can know that output is only as good as the input. You must have a fully understanding of your product, data connections and the "plumbing" underneath.
If you don't understand the black box, you can't prioritize the decision and you can't prevent the hallucinations.
Final thought
My journey from confusion to clarity is about learning to see what's happening behind the product and metrics. When you stop fearing the technical perspective, you will find the peace in your mind.
Stop guessing and start growing!